The recent high profile closure of the Manawatu Gorge, yet again, has raised serious concerns in the Manawatu region; mainly around economics but increasingly about access to health services.
The closure of The Gorge is not unprecidented. In 2011 it was closed for a year. We took the opportunity after that period to look at the impacts that the increased travel times were having on access to both hospital and general practice services throughout the district. You can read the full academic article here ( it is behind a paywall unfortunately), or the much more detailed thesis (open access).
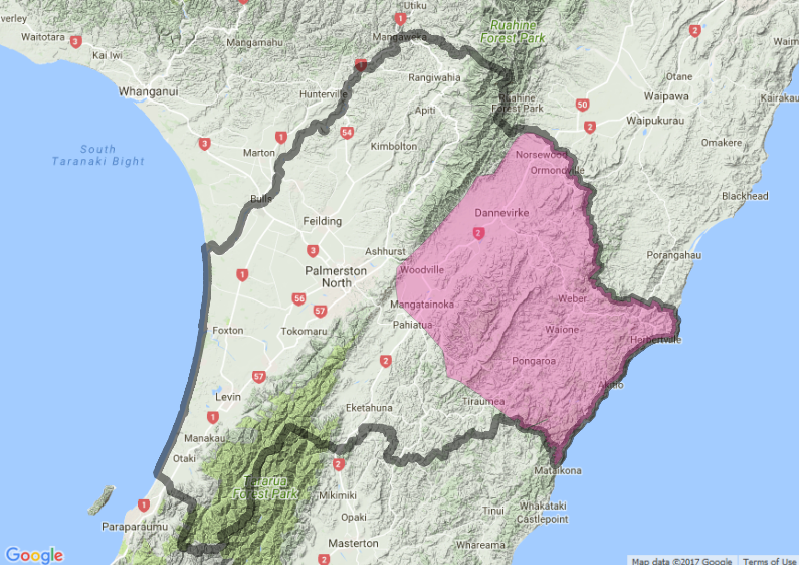
Using our own travel time model, we were able to calculate the area affected (pink shaded) by an increased travel time to Palmerston North hospital. Those people living in the shaded area experienced an increased travel time to the hospital from their homes while the Gorge was closed. We calculated this using a detailed road network model, specifically design and validated for NZ road travel times. The bold outlined area shows the extent of the MidCentral Health District.
We used a self-controlled case series to help control for a number of factors affecting presentation to health services. We looked at two groups of people both before and during the closure of The Gorge. The unaffected group where those individuals who lived in the region for the both the year prior and the year during the closure but were not affected by the closure as measured from their home address and health services. The affected group were those living in the region both for the year prior and year during the closure, but did have an increase in travel time to health services when the gorge was closed.
Each individual’s presentations to health services were paired for the period before and during the closure to represent changes in the use of those services. Results were aggregated and we calculated 95% confidence intervals, and the results are presented below. Those points falling above the dotted line represent increase use during the Gorge closure, those falling below represent decreased use. Consider the results to be different before and after only if the error-bars for each point do not encompass the dotted line ( no change ).
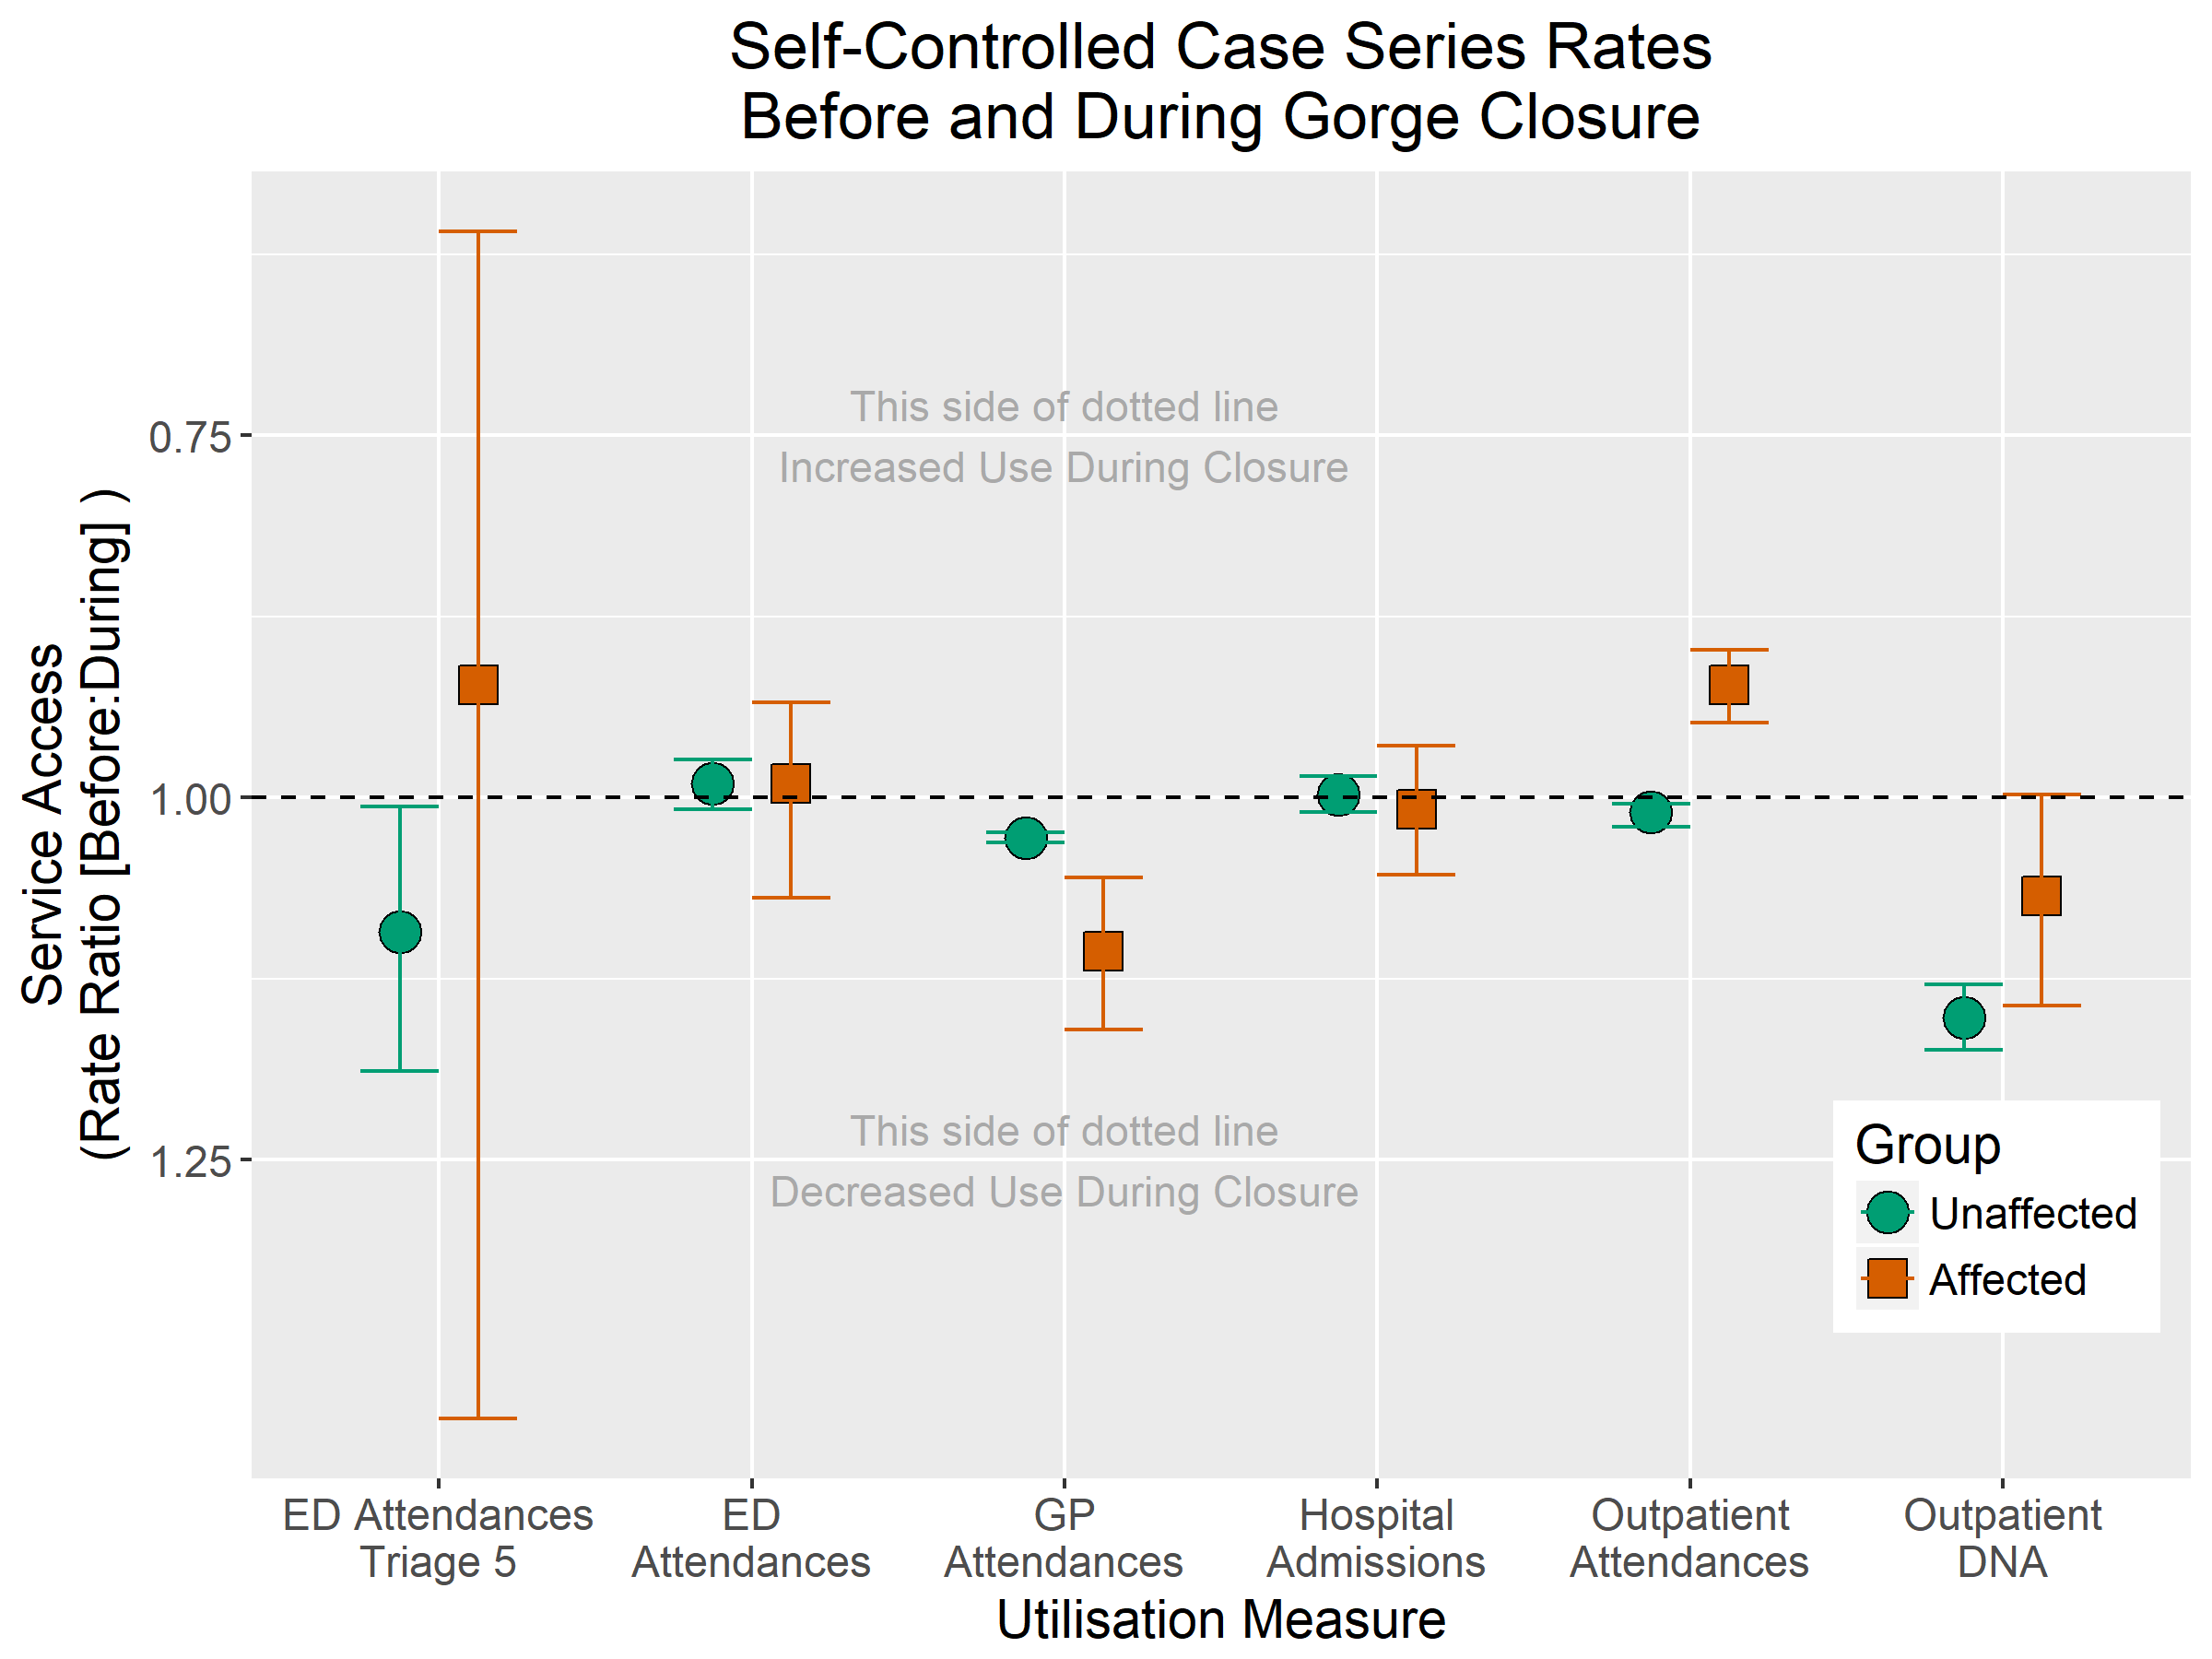
There was a slight decrease in Non-urgent ED Attendance (Triage 5) in the group unaffected by the Gorge closure. This is likely explained by other system or environmental factors that influenced those living in the western areas of MidCentral. There was no change in the affected group, with wide confidence intervals reflecting the relatively low number of non-urgent ED attendances overall. There was no change in ED Attendances for either the affected, or unaffected group.
GP Attendance dropped for both the affected and unaffected groups (again suggesting systemic or environment factors at play) but the drop was more marked in the group affected by the closure. The design of our study did not allow us to identify the causes of other factors at play. It is a reasonable assumption however that the closure of the Gorge may have affected both patient’s willingness to attend general practice, or general practice workforce’s availability during this period ( where the workforce may have needed to travel across the Gorge to attend work ).
Similar to ED Attendances, there was no change in either group for Hospital Admissions.
Unexpectedly, we found an associated increase in Outpatient Attendances for those affected by the Gorge closure. There was no associated change in the unaffected group, ruling out the likelihood of a widespread systemic cause (such as more Outpatient clinics being available). This was accompanied by a trend in both groups of Outpatient DNAs ( missed appointments ). This second result strongly suggests that there was some systemic factor which resulted in fewer patients missing their appointments. This may include the use of reminder letters, reminder phone calls or text messaging to decrease rates of non-attendance at the clinics.
GP Access
Modelling how GP access changed during the Gorge closure was a more difficult undertaking than modelling hospital access, because we had to model multiple service locations (where each general practice is located), against multiple demand locations (where patients live). The below is a map that shows our best approximation of the areas most affected during the Gorge closure. We used a technique called the tw0-step floating catchment, using a distance-decay approach to account for multiple service and demand locations. Shown in the figure below is the area where the access decreased by more than 20% between the Gorge open and closed periods. The area to the North-east of Feilding is an artifact of the noise inherent in the method used to produce the model rather than a real result.
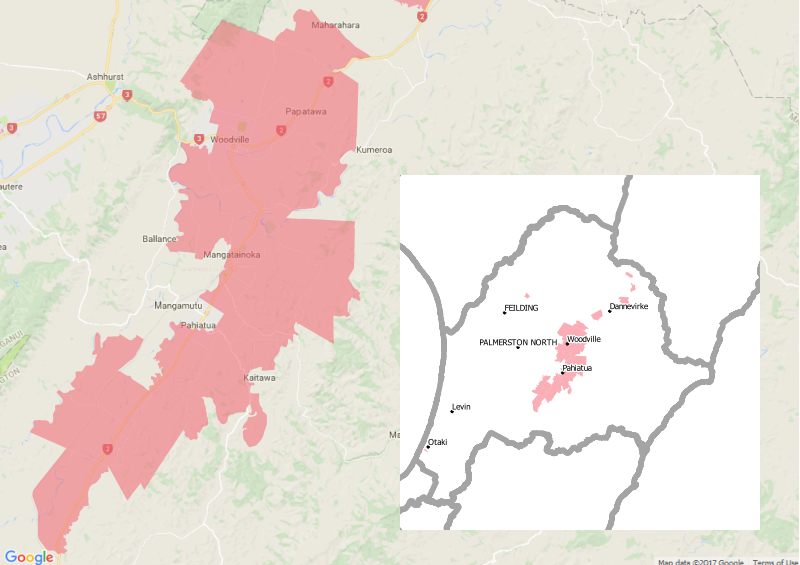
This type of model does not rely on actual visit data, but rather models ‘potential accessibility’ to general practice. Think of it as a model of people’s options to access general practice. Those living in and around Woodville and Pahiatua before the Gorge closure had relatively easy access to general practices in Ashhurst and even eastern Palmerston North. With the closure, their choice of general practice became more limited, eliminating all except those practices on the eastern side of the region. This access model appears to correlate to the observed decrease in use of general practice by those affected by the Gorge closure.
If the Manawatu Gorge is going to be closed permanently, there may have to be some serious consideration given to how the district is served by health services. While our study showed hospital services appeared largely unaffected, our study was not able to account for any increased economic or social cost to those living in the east in order to attend those appointments. Anecdotal evidence suggests that there are additional costs for people in travelling to appointments over the alternative routes, both in time, fuel and vehicle maintenance. For those that use health services infrequently, these costs may be negligible but for those that attend clinics and appointments at the hospital on a regular basis the costs can mount. The decrease in GP attendance may be explained by treatment-seeking delays, which over a longer period may have an adverse impact on the health of those in the region; with an associated flow on effect into secondary care services.
DataCraft Analytics undertakes in depth analysis, bringing together many different analytical disciplines, including quantitative methods, spatial modelling, data science and computer science. Talk to us at DataCraft Analytics, if you’d like us to do some meaningful work for you.